

 English
The Ultimate Guide to Using an Equity Curve Simulator for Better Trading Decisions
An equity curve simulator is a powerful tool for traders who want to visualize performance, manage risk, and optimize strategies. Whether you’re in forex equity trading or developing automated systems, understanding your equity curve is critical to long-term success. In this article, we’ll explore how equity curve simulation works, why it matters, and how to use it effectively.
What Is an Equity Curve?
An equity curve is a graphical representation of the growth or decline of a trading account over time. It shows how a strategy performs across a series of trades and reflects real or simulated equity in the account.
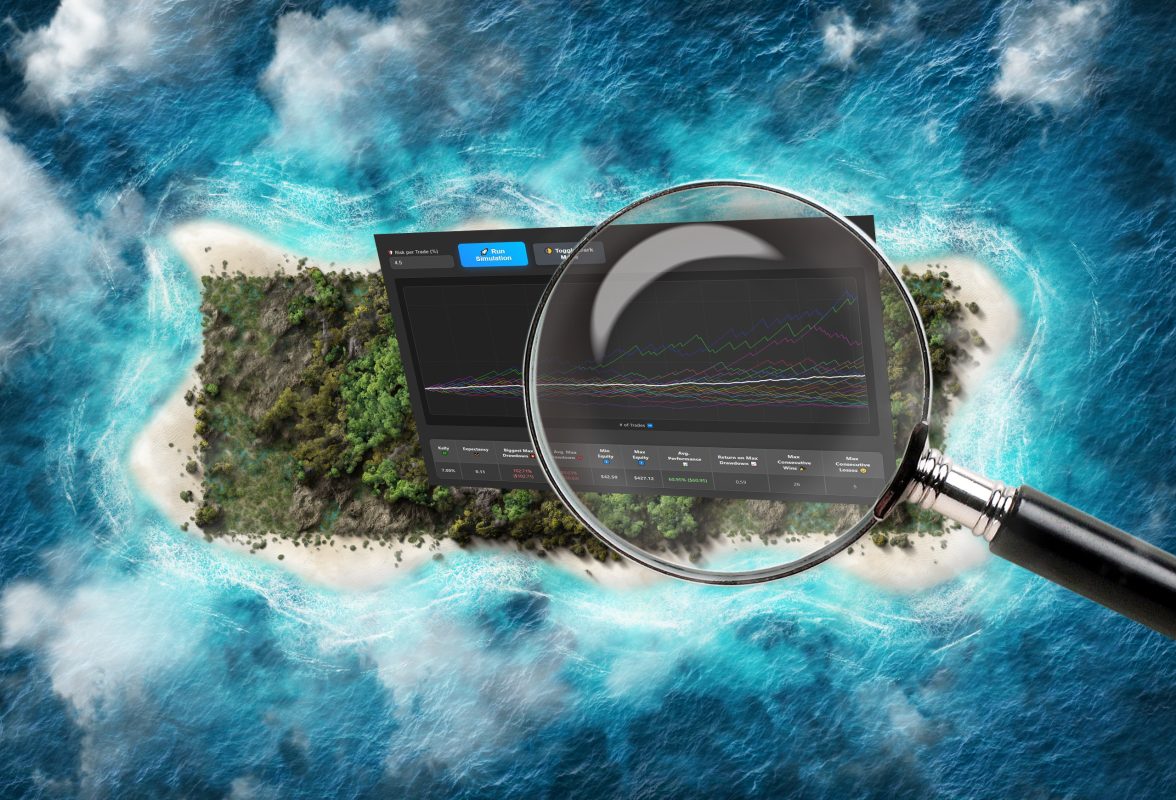
- X-axis: Number of trades or time (days, weeks, etc.)
- Y-axis: Account value (balance or equity)
- The curve may rise (profit) or fall (loss), revealing volatility and risk.
Having a stable and upward-trending equity curve is a key goal for any trader, especially in equity curve trading, where decisions depend directly on curve behavior.
How Does an Equity Curve Simulator Work?
An equity curve simulator uses historical or randomly generated trade results to model the performance of a trading strategy. It allows traders to test different conditions and visualize the possible outcomes.
Key features of a modern equity curve simulator:
- Input parameters like win rate, risk/reward ratio, trade frequency
- Monte Carlo simulations to test for randomness and robustness
- Equity drawdown detection to analyze risk exposure
- Performance metrics like Kelly ratio, Sharpe ratio, and average max drawdown
- Visual output (charts, tooltips, tables) for clear analysis
Our tool even includes dark mode, chart interactivity, and customizable themes to enhance usability.
Why Use an Equity Curve Simulator?
Using an equity curve simulator isn’t just a technical exercise—it’s a necessity for serious traders. Here’s why:
1. Risk Management
Understanding potential maximum drawdowns and minimum equity helps prevent account blowouts.
2. Strategy Optimization
Testing different setups lets traders refine parameters before using real capital.
3. Psychological Preparation
Seeing potential losing streaks ahead of time prepares traders for real-world challenges.
4. Decision-Making in Equity Curve Trading
In equity curve trading, traders use rules based on the curve’s direction (e.g., pause trading during a dip) to reduce losses and protect gains.
How Is Forex Equity Related?
Forex equity refers to the real-time value of a trading account in the foreign exchange market. It’s affected by open positions, margin, and floating profits/losses.
When using an equity curve simulator, forex traders can simulate:
- Realistic pip movement and volatility
- Margin requirements and leverage
- Currency pair behavior over time
This makes equity curve simulators especially relevant for forex equity risk modeling and money management.
Tips for Using an Equity Curve Simulator Effectively
Here’s how to get the most from your simulator:
- Simulate hundreds or thousands of runs to capture randomness
- Use conservative assumptions (e.g., higher loss streaks)
- Pay attention to outliers – what’s the worst-case scenario?
- Compare different strategies side-by-side using average equity, drawdowns, and variance
- Monitor the equity curve regularly in live trading for actionable insights
Common Questions About Equity Curve Simulators
Is an Equity Curve Enough to Judge a Strategy?
No. The curve is important, but should be used alongside metrics like expectation, Sharpe ratio, and historical performance. Look at both shape and stability.
Can You Use an Equity Curve to Time the Market?
Not exactly—but in equity curve trading, many systems use the curve’s slope or drawdown levels to signal whether to continue or pause trading.
Are Equity Curve Simulators Accurate?
They’re as accurate as the assumptions you feed them. Good simulators include randomness and variability to mimic real-world unpredictability.