Explore the inverse head and shoulder, inverse head and shoulders, and the inverse head and shoulders pattern. Understand the head and shoulders pattern, bullish head and shoulders, and how this bullish reversal pattern, technical analysis pattern, and trend reversal pattern help in trading.

What Is the Head and Shoulders Pattern?
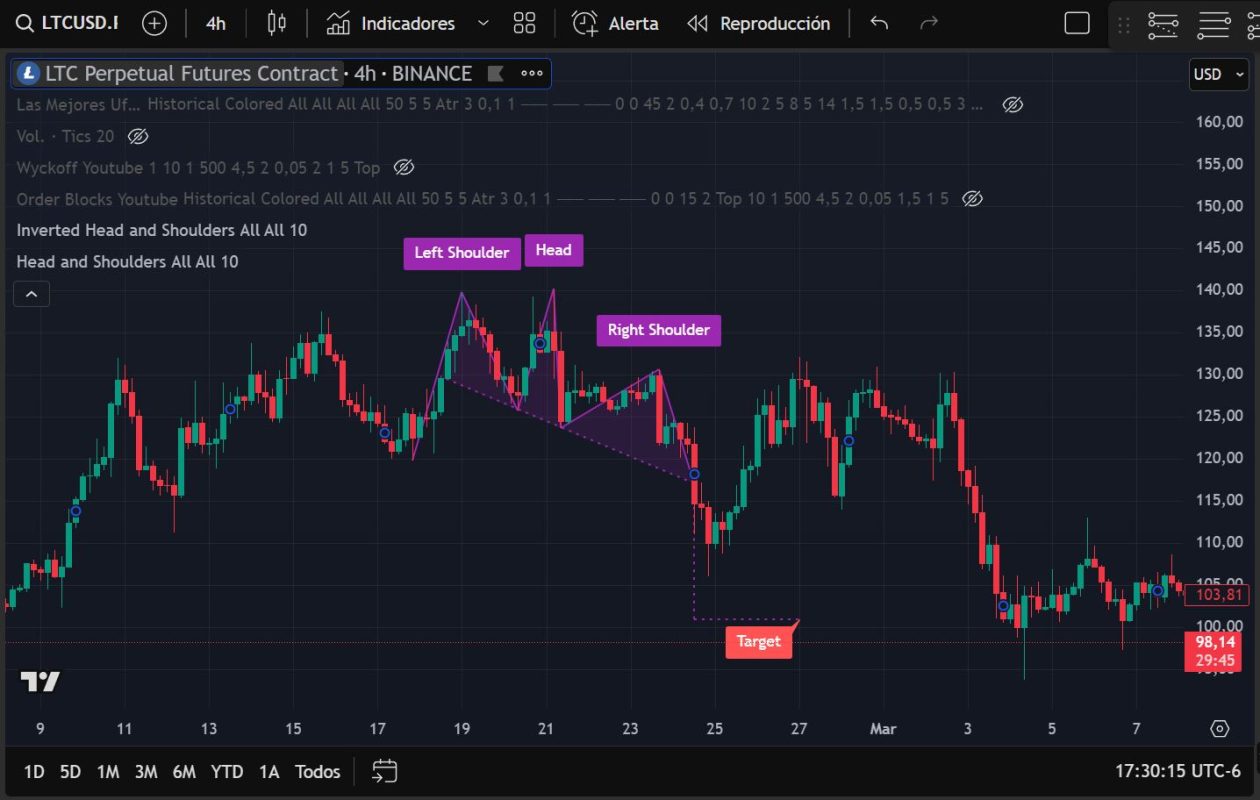
The head and shoulders pattern is one of the most recognized technical formations in chart analysis. It indicates a potential trend reversal and helps traders of all levels spot possible entry or exit points.
Key Features of the Head and Shoulders Pattern:
- Left shoulder: An upward move, followed by a peak and a slight decline.
- Head: A higher peak than the shoulders, followed by a drop.
- Right shoulder: A lower peak, similar to the left shoulder, followed by a drop.
- Neckline: A support level connecting the lows of the two troughs.
Comparison Table: Traditional vs. Inverse Head and Shoulders Pattern
| Feature | Head and Shoulders | Inverse Head and Shoulders |
|---|---|---|
| Signal Type | Bearish | Bullish |
| Market Context | End of uptrend | End of downtrend |
| Price Target | Downward projection | Upward projection |
| Reaction After Confirmation | Sell or short | Buy or long |
| Frequency | Common in volatile markets | Common during recoveries |
What Is the Inverse Head and Shoulders Pattern?
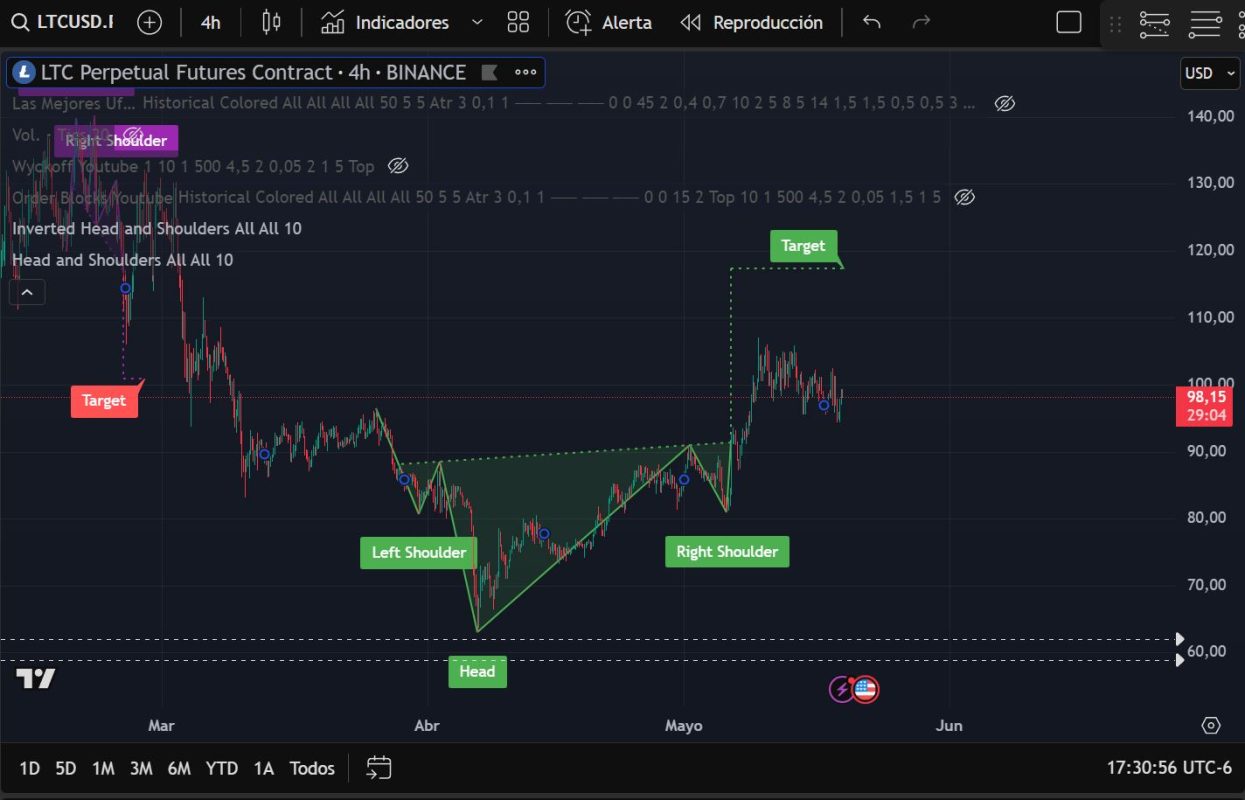
Also known as the inverse head and shoulder or inverse head and shoulders, this formation is the mirror image of the traditional pattern. Instead of three peaks, the pattern consists of three troughs during a downtrend, suggesting a potential bullish reversal.
When Does the Inverse H&S Pattern Appear?
It typically emerges at the end of a prolonged decline, signaling that buyers may be regaining control.
How to Identify a Bullish Head and Shoulders (Inverse)?
The term bullish head and shoulders usually refers to the inverse head and shoulders pattern. In this version, each dip becomes progressively less severe, and a breakout above the neckline often leads to upward price movement.
Key Signals to Spot a Bullish H&S:
- Three consecutive lows, with the middle one (the head) being the lowest.
- Increasing volume during the neckline breakout.
- Confirmation with a close above the neckline.
How to Trade the Head and Shoulders Pattern
Strategy for the Traditional Pattern:
- Wait for the full pattern to form.
- Draw the neckline connecting the troughs.
- Enter a short trade when the price breaks the neckline.
- Set the price target by measuring the distance from the head to the neckline.
Strategy for the Inverse Head and Shoulders:
- Identify the three troughs clearly.
- Confirm breakout with increased volume.
- Enter a long trade after a confirmed breakout above the neckline.
- Place a stop-loss below the right shoulder.
Frequently Asked Questions about the Head and Shoulders Pattern
Is the Head and Shoulders Pattern Reliable?
Yes, it is considered one of the most reliable chart patterns in technical analysis, especially when confirmed with volume and price action. However, like any tool, it’s not foolproof and should be combined with other indicators.
What’s the Difference Between Head and Shoulders and Inverse?
- The traditional head and shoulders pattern predicts a bearish reversal.
- The inverse head and shoulders (also called bullish head and shoulders) signals a potential upward reversal.
Does It Work on All Timeframes?
The pattern can be observed on multiple timeframes but tends to be more reliable on higher ones (4H, daily, weekly) due to reduced market noise.
Can the Pattern Fail?
Yes. A “failed H&S” occurs when the price breaks the neckline but then reverses back, invalidating the setup. Always use confirmations before acting.
TradingView Indicator for Bullish and Bearish Head and Shoulders Patterns
For traders seeking to automatically detect head and shoulders or inverse head and shoulders setups, TradingView offers advanced indicators. One of the most popular is the “Head and Shoulders Pattern” by TRN-Trading.
Key Features:
- Automatic Detection: Finds both regular and inverse head and shoulders patterns.
- Visual Clarity: Displays potential entry, stop-loss, and take-profit levels.
- Real-Time Updates: Continuously adapts as the pattern develops on the chart.
🔗 Access it here:
👉 Head and Shoulders Pattern TradingView
Conclusion
The head and shoulders pattern is a powerful tool for anticipating market reversals. Whether you’re trading the traditional bearish version or the inverse head and shoulders pattern, recognizing the setup can offer key advantages in timing your trades.
Incorporate this formation into your technical analysis toolbox, pair it with strong risk management, and you’ll be better prepared for shifts in market trends.
if you have any doubts about hanging man candlestick pattern read the following article