

 Español
RSI Indicator: What It Is, How to Use It, and Why It’s Not Always Profitable
Introduction
The RSI indicator (Relative Strength Index) is one of the most popular technical analysis tools in trading. It’s included by default on almost every exchange platform like Binance or TradingView.
However, many traders wonder: Is the RSI strategy really profitable?
This article explains what the RSI is, how to use it, common mistakes, and a step-by-step guide to the classic RSI strategy with divergences plus why it might not be as effective as people think.
Who Invented the RSI Indicator and How It Became Popular
The RSI indicator was created by J. Welles Wilder Jr. in 1978. He introduced it in his influential book “New Concepts in Technical Trading Systems,” where he also presented other well-known tools such as the Average True Range (ATR), the Parabolic SAR, and the Directional Movement Index (DMI).
At the time, the RSI was designed to measure the relative strength of price movements and help traders identify potential reversals during market extremes. Its simple calculation and clear 0–100 scale made it easy to adopt, even before the era of digital trading platforms.
The indicator gained massive popularity in the 1980s and 1990s as technical analysis software became accessible to retail traders. Later, with the rise of online platforms like MetaTrader, TradingView, and Binance, the RSI became a default tool featured in nearly every charting interface.
Today, the RSI strategy is taught in almost every trading course, often promoted as a beginner-friendly method for spotting overbought and oversold zones though, as discussed, it’s not always a profitable strategy when used in isolation.
What Is the RSI Indicator and How Does It Work
The RSI (Relative Strength Index) is a momentum oscillator that measures the speed and change of price movements.
It ranges from 0 to 100 and is used to identify potential overbought and oversold conditions.
- RSI above 70 → Overbought zone (possible correction)
- RSI below 30 → Oversold zone (possible rebound)

The classic RSI strategy works best in sideways or ranging markets but becomes unreliable in strong trends. Traders often use it with other indicators like moving averages or Bollinger Bands for confirmation.

Is the RSI Profitable? Pros and Cons
Advantages of the RSI Indicator
- Simple and available on every trading platform.
- Helps identify potential turning points.
- Useful as a secondary filter within a larger strategy.
Disadvantages and Common RSI Mistakes
- In trending markets, it can stay overbought or oversold for long periods, generating false signals.
- Does not include volume or market structure data.
- Many traders use it mechanically without real context.
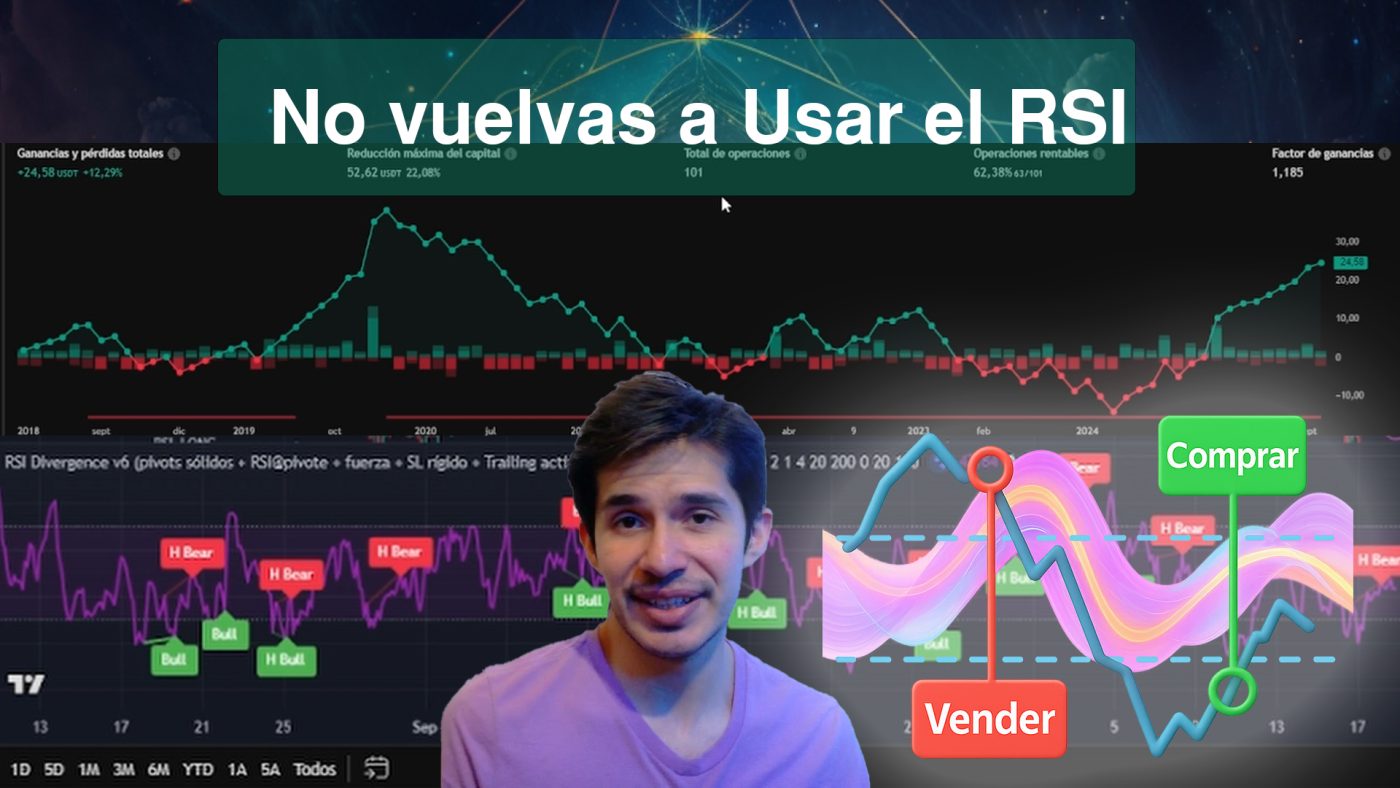
In reality, backtests on assets like Bitcoin show that the RSI strategy often delivers few trades and low total returns (e.g., 24% over 8 years on 3-hour BTC charts). That makes the RSI not profitable on its own.
Classic RSI Strategy Step by Step
1. Initial Setup
- Add the RSI indicator to your chart.
- Default period: 14.
- Levels: 70 (overbought) and 30 (oversold).
2. Identify Conditions
- RSI < 30 → possible long setup.
- RSI > 70 → possible short setup.
3. Confirm With Divergences
A divergence happens when price and RSI move in opposite directions:
- Bullish divergence: Price makes a lower low, RSI makes a higher low → momentum is weakening on the downside.
- Bearish divergence: Price makes a higher high, RSI makes a lower high → upside momentum is fading.
Divergences can be powerful reversal signals, but they often take time to play out and can fail in strong trends.
4. Entry and Exit
- Wait for the divergence and RSI confirmation.
- Use a fixed stop-loss (2–4%) and a take-profit or trailing stop.
- Exit early if the signal fails or the RSI crosses back mid-range.
5. Risk Management
To avoid large drawdowns:
- Never risk more than 1–2 % per trade.
- Always confirm with support/resistance or volume.
- Don’t rely solely on RSI readings — use it as part of a bigger system.
RSI Divergences Explained
Many traders misuse RSI divergences. To detect them correctly:
- Choose a timeframe with meaningful market movement.
- Draw trendlines connecting price highs/lows and RSI highs/lows.
- Watch for mismatched direction (price up / RSI down = bearish divergence, and vice versa).
- Wait for confirmation before entering — divergence alone isn’t enough.
Why the RSI May Not Be Profitable
The RSI is widely promoted in books, tutorials, and exchange interfaces, but that doesn’t mean it’s a guaranteed strategy.
Some reasons why RSI underperforms:
- Generates few high-quality signals per year.
- False signals appear during strong directional markets.
- Doesn’t account for fees or slippage.
- It’s so popular that it often becomes part of the crowd’s liquidity — exchanges may benefit more than traders.
Ultimately, the RSI strategy fails when used in isolation. It can be useful only when combined with sound risk management, diversification, and data-driven testing.
If you would like to learn a strategy such as Fibonacci retracement, take a look here.